Our Largest Dataset Yet: A Launchpad for the Future
Written by
Mark Connolly
on
October 21, 2025
Guest post by Andrew Schoenen, a UC Berkeley senior studying Computer Science and Ecosystem Management and Forestry. Andrew has been collaborating with the Tidepool team to analyze data from the Big Data Donation Project—bringing together his passion for technology, data, and the environment to help drive meaningful insights for the diabetes community.
Thanks to more than 50,000 people who donated their diabetes data, Tidepool now has the largest real-world dataset we’ve ever collected. This dataset represents thousands of person-years of lived experience with diabetes.
This generosity is a foundation for discovery, which can help explain what life with diabetes really looks like across ages, decades of experience, and different treatment eras.
From the data we have collected, here are a few observed highlights that represent some of the general trends or commonalities across the broad dataset:
1. Time in Range improves with experience
The data show that time in range (TIR) improves steadily over the years. Both age and years since diagnosis play a role, but years since diagnosis show a stronger link. Median TIR starts around 63% in childhood, crosses the 70% target recommended by the ADA Standards of Care by the early 30s, and reaches about 78% among those 65–85 years old.
Why it matters: This suggests that experience with diabetes may be just as powerful—if not more—than age itself, offering hope that with time, routines, and support, outcomes can improve.
2. Highs come down with age, lows stay steady
The data show that high glucose tends to come down with age, while lows stay fairly steady. Average time spent above 180 mg/dL drops from about eight hours per day in children to around five hours in older adults. Time spent above 250 mg/dL is cut nearly in half. Meanwhile, time spent below 70 mg/dL averages about 40–45 minutes per day across all age groups, with time below 54 mg/dL staying under 10 minutes per day.
Why it matters: For families and clinicians, it’s reassuring to observe a trend that highs become less frequent over time. Lows, in contrast, don’t really decline with age - but because they make up a much smaller portion of the day compared to highs, the overall risk of dangerous lows remains relatively low and stable.
3. Average glucose and A1c follow a similar curve
Average glucose and estimated A1c (eA1c) follow a similar pattern. Levels tend to peak in the teenage years at about 166 mg/dL (eA1c ~7.5%), then decline into the mid-140s and below 7% through mid-life, and settle around an eA1C of 6.5% in retirement.
Why it matters: This reflects what many in the community already know: adolescence is the hardest stage for glucose control. But it also highlights the encouraging reality that most adults in the dataset meet—or beat—the ADA’s recommended target of keeping A1c below 7%.
4. Glucose variability eases with age
Glucose variability changes with age. During growth and puberty, the glucose curve widens, but over time the distribution tightens. In other words, the “rollercoaster” effect may ease as hormones settle and routines become more consistent.
Why it matters: Variability makes diabetes management unpredictable and stressful. Seeing that swings may calm over time reinforces the importance of support during puberty and shows that stability is achievable.
5. Data donors bring a wide range of experience
Data donors bring a wide range of experience with diabetes. About 30% were diagnosed within the past 10 years, around 40% have lived with diabetes for 10–30 years, and a small group has 40+ years of experience to share.
Why it matters: This diversity allows researchers to compare experiences across different diagnosis eras—revealing how advances in technology and education have shaped outcomes, and where gaps remain.
A Note on Medians
When we share results, you’ll often see us focus on the median instead of the average. The median is the “middle point” of the data—half of people are above it, and half are below.
Why use it? Because averages can be skewed by extreme highs or lows. Medians give a clearer picture of what a typical person in the dataset experiences.
Why it matters: For people living with diabetes, this means the numbers you see here are less about outliers and more about what’s common across the community—helping research stay grounded in real, everyday experience.
Representation and Bias
Before we get into more detailed analysis, it’s critical to recognize that while this dataset is powerful, we also know that it doesn’t represent everyone living with diabetes equally. This dataset does not consider demographic data like gender, race, income, or geography. Tidepool users are not required to self-disclose their diabetes type in their user profile, though many do choose to share this information. We recognize that this dataset may more strongly reflect the experiences of people with consistent access to resources, technology, and reliable insurance.
Why it matters: To create tools and insights that truly serve the whole community, we need more diversity in the data. Expanding participation across different backgrounds will help ensure future research and software reflect the needs of allpeople with diabetes, not just those who are most visible today.
Balancing inclusivity with safety is central to Tidepool’s mission. Everyone’s diabetes is different, and we want to recognise and support this in our work.
Big Picture
Glucose Distribution
Data donors spend about two-thirds of their time in the 70–180 mg/dL range, with modest exposure to lows (<3%) and a larger share—around 27%—above 180 mg/dL. In other words, highs are far more common than lows.
Why it matters: This confirms what many in the community already experience: staying in range is less often about dangerous lows and more frequently about taming the highs. Understanding when and why those highs happen is key to developing better strategies and software tools that help smooth them out.
Who are our data donors?
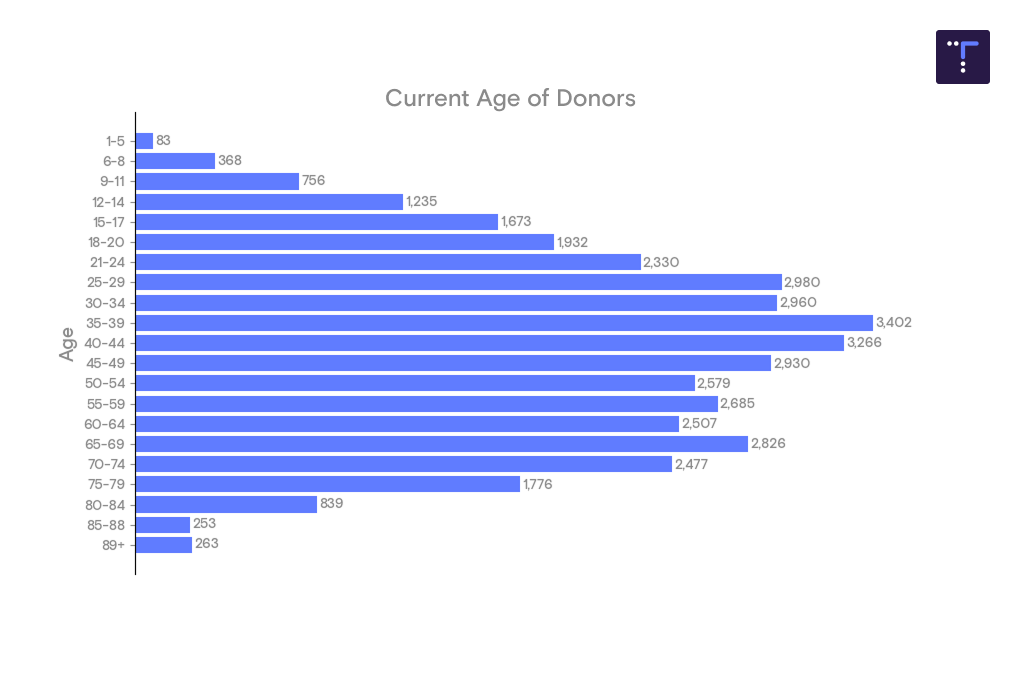
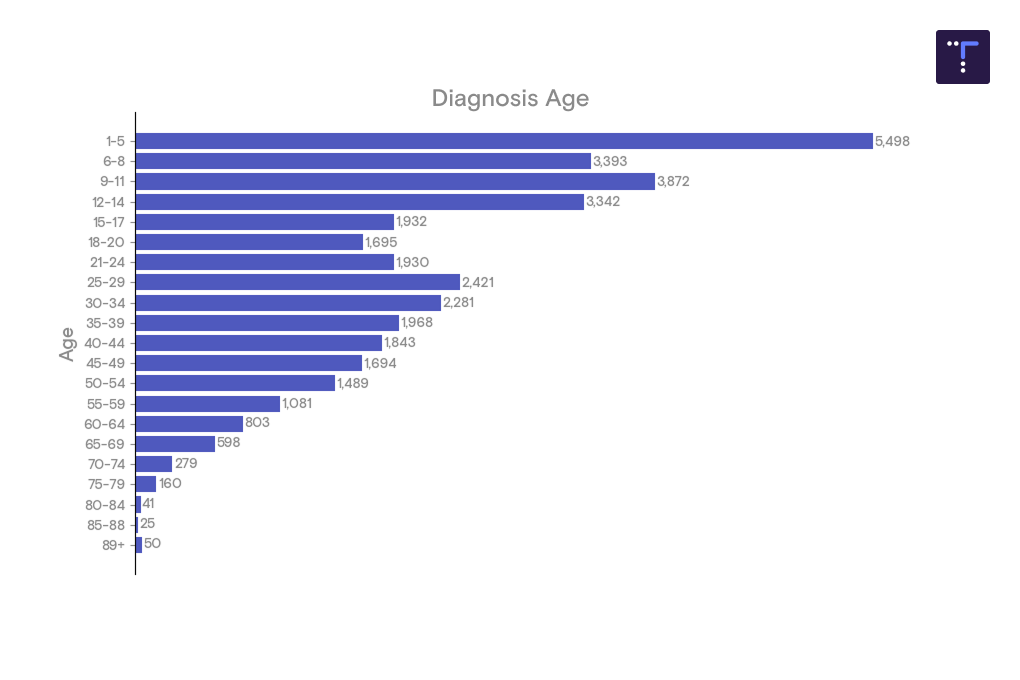
Current & Diagnosis Ages of Donors
Our dataset includes donors covering a wide range of ages, with the largest group represented by people in their 20s–40s. That means the strongest insights will reflect the experiences of working-age adults, while data from very young children and older adults, though valuable, are thinner.
Nearly two-thirds of data donors were diagnosed before age 15. This creates a powerful lens on childhood-onset diabetes carried into adulthood, while later-onset diagnoses become less common.
Why it matters: Knowing who’s represented helps set the right expectations for what the data can tell us. For now, it gives us high confidence in trends for people diagnosed as kids and living with diabetes through adulthood—insights that can directly inform care during those stages.
Years of Experience
About two-thirds of data donors are within their first 20 years of living with diabetes, while about one in five have 25–40 years of experience. A smaller but inspiring group has logged 50 years or more.
This spread of experience allows us to compare how diabetes management patterns have changed across different eras. For example, we can see how people who began with hybrid closed-loop systems differ from those who started with NPH and fingersticks. In that sense, the dataset is not just a snapshot of today, but a living history of diabetes care.
Why it matters: By looking across diagnosis eras, we can see the real-world impact of education, technology, and care advances over time—helping to understand what’s working, where gaps remain, and what future innovations should build on.
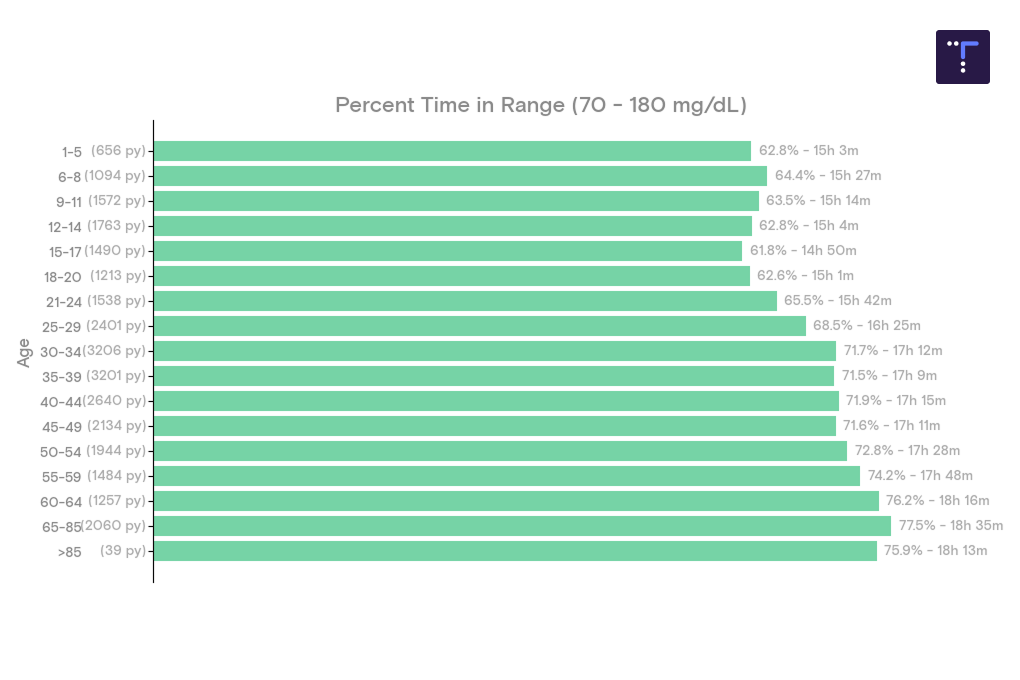
Median Time in Range (70–180 mg/dL) by age vs. years since diagnosis
The median time in range (TIR) increases from approximately 63% in early childhood to nearly 78% in older adulthood (ages 65–85). By the early 30s, it surpasses the ADA-recommended target of 70%, and the swings get smaller and smaller after young adulthood.
What’s driving that improvement? The data suggest that years since diagnosis are more closely tied to higher TIR than age itself. After the first five years—often called the honeymoon period—the trend in Median TIR gradually increases over the years of lived experience with diabetes.
Why it matters: These trends highlight both the challenges of adolescence and the hope that comes with experience. Puberty brings greater variability, but stability increases over time. For families and newly diagnosed individuals, it’s reassuring to know that diabetes management often becomes easier and more consistent as the years go by.
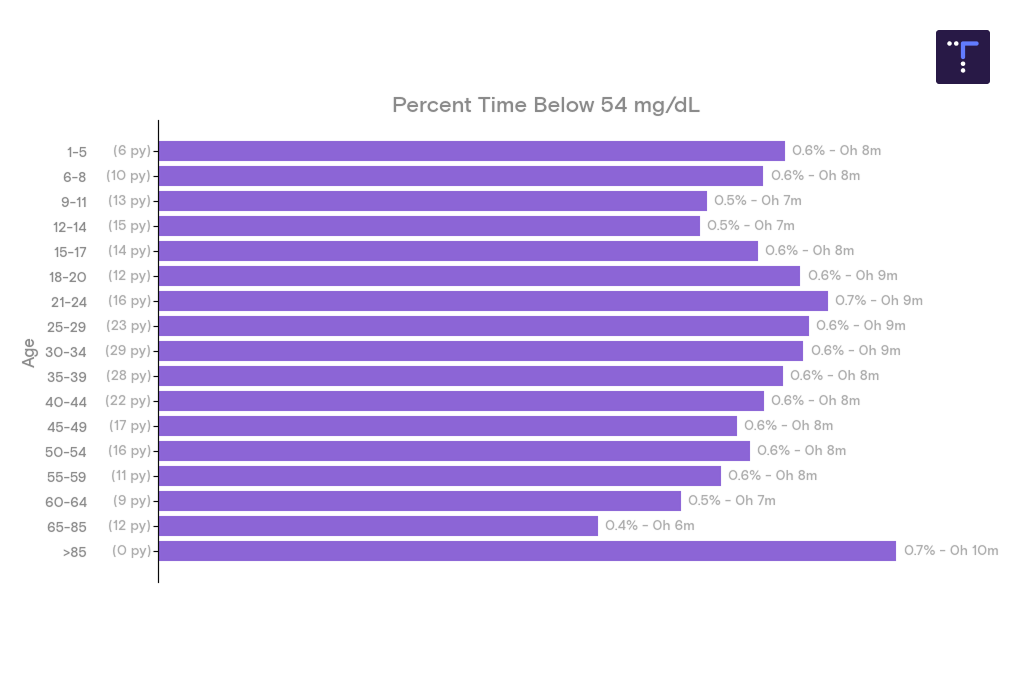
Time Below Target
Across every age group, the median data donor spends well under 1% of the day—about 9 minutes—below 54 mg/dL. The consistency is striking: average time below 54 mg/dL varies by only a few minutes per day across all age slices.
While the very oldest age group (85+) shows a slightly higher average, this reflects the limited number of donors in that band and should be interpreted with caution.
Why it matters: Lows below 54 mg/dL are the kinds that trigger multiple alarms and cause the most worry for families and clinicians. Seeing them remain both rare and consistent across ages is a strong indicator of how much modern CGMs and insulin delivery tools are helping to keep people safe.
Lows under 70 mg/dL are remarkably stable across all age groups. Data donors spend about 40-47 minutes per day below 70 mg/dL - less than an hour per day. Children under 13 have the briefest lows (~37 minutes), with a slight increase at both ends of the age spectrum. Importantly, all TBDDP age groups remain comfortably under the ADA-recommended target of spending less than 4% of the day below 70 mg/dL for nonpregnant individuals with type 1 or type 2 diabetes under the age of 65.
Why it matters: These results show that age itself isn’t the main driver of everyday low glucose. This suggests the biggest opportunities for improvement now may lie in individualized dosing strategies, rather than age-specific programs.
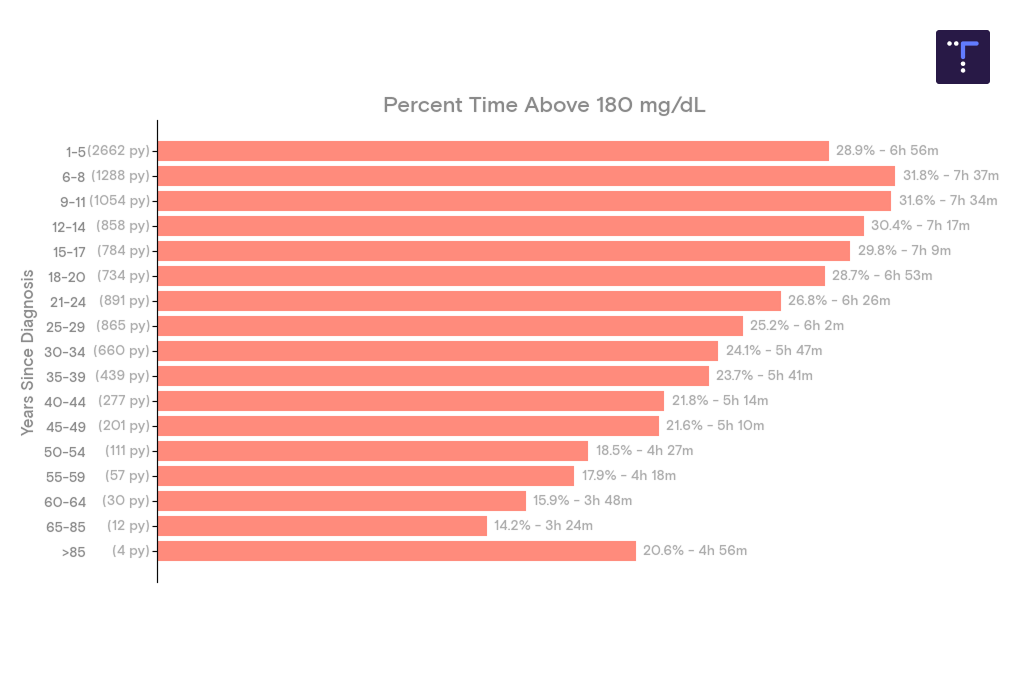
Time Above Target
In childhood and the teenage years, donors spend about 33% of the day—roughly eight hours—above 180 mg/dL. This share falls through adulthood, landing around 22% (~five hours) by the early 60s, and dips below 20% in many retirees.
Why it matters: These patterns mirror what we see with time in range. Hormonal shifts during growth spurts may make management more challenging in youth, while older age and lived experience brings greater stability. The data highlight adolescence as a critical window for extra support.
Time spent in more significant highs is less common but follows the same trajectory. Children spend about 11–12% of the day (~three hours) above 250 mg/dL. By the mid-30s, that burden is cut nearly in half, and it falls to around 4% by the late 60s.
Why it matters: While sharp peaks don’t disappear completely, they become far less common with age and experience. This reinforces the importance of targeted support for children and adolescents when these highs are most frequent.
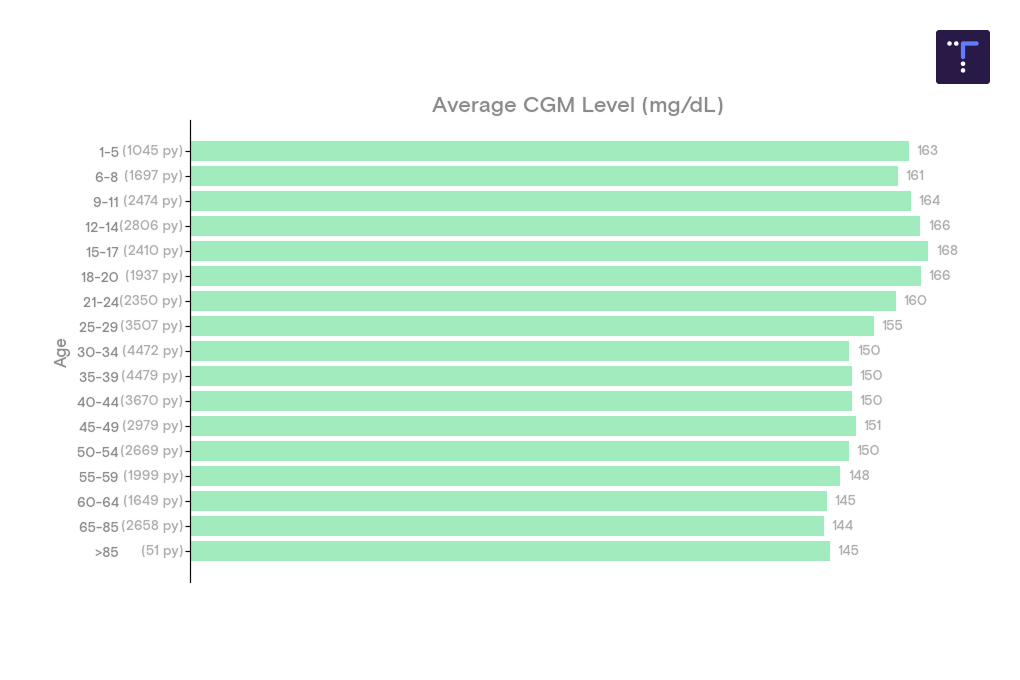
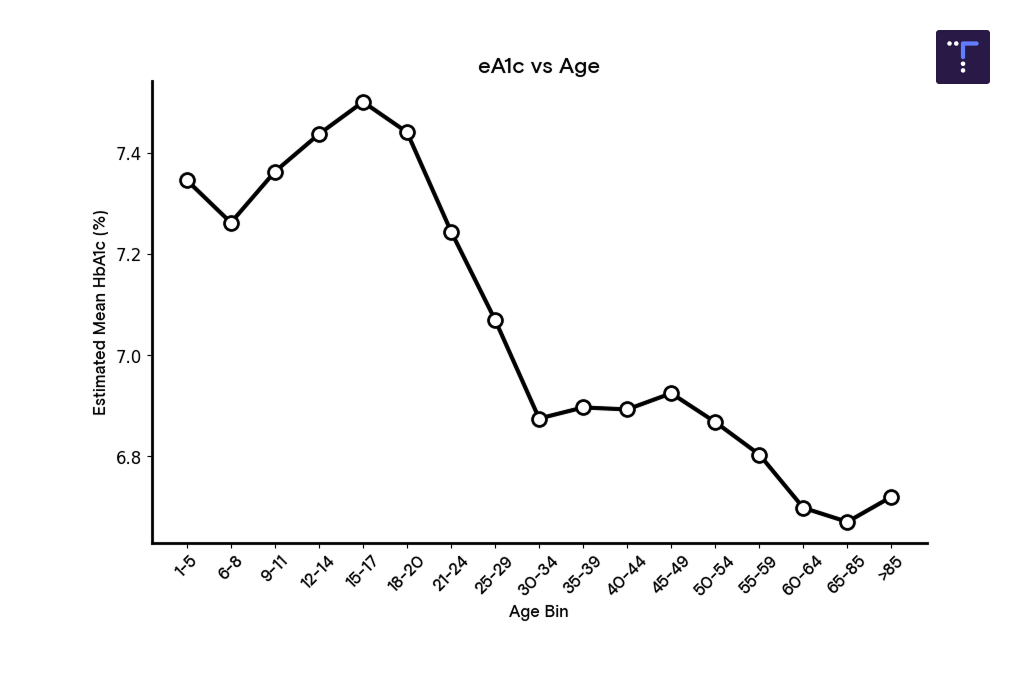
Average Glucose and Estimated A1c
Why it matters: These trends align with time-in-range and high blood sugar data. Puberty makes glucose management especially difficult, but outcomes steadily improve and stabilize through adulthood. The reassuring message is that most adults in the dataset meet, or even beat, the recommended targets for A1c of less than 7% and time in range for people with diabetes, as outlined in the ADA Standards of Care.
Comparing these two charts, average glucose peaks during adolescence at about 166 mg/dL (estimated A1c ~7.5%), then decline by roughly 20 mg/dL through the late twenties. For most of adulthood, averages settle in the mid-140s, with an estimated A1c below 7%, and then flatten after age 30. In retirement years, values remain steady, around 6.5% A1c.
In other words, estimated A1c tracks the same arc we see in glucose data: a modest puberty bump, followed by a steady descent below ADA Standards of Care targets through adulthood and into older age.
What This Opens Up
These findings are exciting on their own—but the real power of this dataset is what it makes possible. With so much donated data, we can explore new questions that weren’t answerable before, and design tools that give back to the community. Just a few examples:
Puberty insights. Variability spikes during adolescence are clear in the data. With so many young donors represented, we can better understand how hormones affect glucose—and build tools that help smooth out this especially challenging stage.
Experience vs. age. Early results suggest that years since diagnosis may influence outcomes more than age itself. This opens the door to new research on how experience shapes management, especially for those newly diagnosed.
The “experience effect.” Our dataset enables us to compare individuals of the same age but diagnosed at different ages—for example, a 25-year-old diagnosed at age 10 versus one diagnosed at 22—to determine when and how experience surpasses physiology.
Variability analysis. With so many CGM traces, we can dig into how glucose swings differ across groups and time periods, and explore algorithm improvements to make spikes and drops less common.
Signatures of highs and lows. By mapping the shape of glucose excursions—slow drifts versus sharp spikes—we can improve predictions and, eventually, design software that responds more effectively.
Bring this data into your next project
This dataset isn’t just for Tidepool—it’s meant to spark collaboration and innovation across the community.
For companies: Partner with us to better understand the real-world needs of people with diabetes and build solutions that make a difference.
For researchers and citizen scientists: Access real device data to power your projects. We’re building programs to make datasets available for free or at greatly reduced cost. Learn more here.


.png)